Analisi statistica della operatività del Trading System T50R dal 08.01.2016 to the 19.02.2016
Analisi statistica di operatività del Trading System T50R from 08.01.2016 to the 19.02.2016 il periodo esaminato rappresenta il 15% della annualità:

Analisi statistica di operatività del Trading System T50R from 08.01.2016 to the 19.02.2016 il periodo esaminato rappresenta il 15% della annualità:
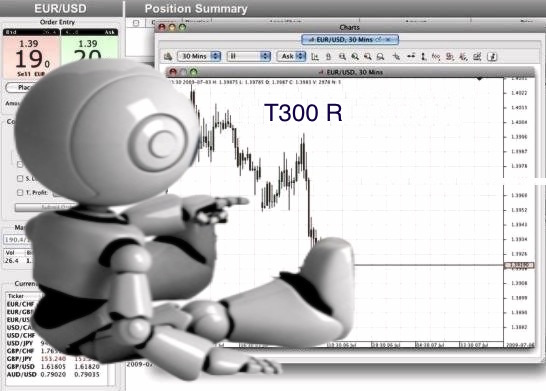
Calculation Exchange rates Robotic T300 R provides operational information on the forex market, using a sophisticated algorithmic computation driven by neural networks, capable of providing point of open, buy o sell, stop loss, target, flat, line seizure. The system described is technically suited to operations carried out through exchange platform. […]
 MIDDLE TIME EUR/USD : The development of the calculation currency product in days 25.07.2014 and confirmed the 27.07.14, provided the reversal point of the bearish signal to share 1,3470, have already had confirmations to share 1,2750 ( S1) , a 1,2500 (S2) , a 1,1800 (S3). Currently we are down between the level S3 and S4, the latter place to share 1,04, After this threshold, the market will proceed for equality, in fact, the S5 is placed in 0,9990, the next support is
calculated 0,9200/50, while the final movement in anticipation for the end of summer 2016 is placed into the box 0,8200/50. […]
 As known to users of the Calculation Exchange rates T300 series, the main signal of decline over the medium term was provided in July 2014 to share 1,3470. The market in recent months has brought on intermediate supports, first place in area 1,2500, level from which rebounded up to 1,2880, This downward movement took to realize 10 figure ( about 1000 Only ) little less than 5 months. In December, we have witnessed an acceleration of the movement, in fact little more than a month we have gone from a max ( calculated from T300 to 1,2550/70 ) to a minimum to make the 24.01.15 place to share 1,1105 , equal to a 21% downside from the main signal of the euro against the dollar 21%. […]
Analysis cross Eur / usd: As known to users of the Calculation Exchange rates T300 series, the main signal of decline over the medium term was provided in July 2014 to share 1,3470, the market in recent months has brought on intermediate supports, first place in area 1,2500, level from which rebounded up to 1,2880, This downward movement took to realize 10 figure ( about 1000 Only ) less than 5 months. In December, we have seen an acceleration of the movement, In fact, in just over a month we went from a max ( calculated from T300 to 1,2550/70 ) to a minimum to make the 24.01.15 place to share 1,1105 , equal to a 21% di ribasso dal segnale principale dell’euro sul dollaro del 21% . All this is made exclusively on the words as interventions related to the QE will be activated by the ECB from 1 March 2015 for purchases of government bonds amounting to 60 billion per month until September 2016.In data 25 September 2014 the violation occurred stable share 1,2740, if the same will be confirmed with falling prices in the market share 1,2610 will see an expansion of the fall that will have as intermediate supports share 1.2500/30, second level of support place to 1,2300/30, third level of support place to 1,2000/50. The triangle 1) represents the portion of the current mkt, triangle 2) defines the minimum target, Figure number three defines the excursion time with various intermediate supports above said. The red dotted line is the level of violation that prices should have to have the downward movement described above. The purple line defines the inclination, then the intensity of the volumetric motion short. […]